


In the early months of the epidemic, home sales in the United States experienced a dramatic increase. The homeownership rate in the United States increased from the first to the second quarter of 2020 by the biggest margin since records began being kept in the mid-1960s. Furthermore, property taxes are just one of the many additional costs associated with home ownership.
Local governments (such as municipalities, counties, and school districts) are the typical leviers of property taxes. Vehicles and watercraft are subject to additional taxes by many state governments.
Communities around the United States rely heavily on property taxes to pay for essential public services, including education, police enforcement, and infrastructure development. In fiscal 2020, property taxes were the largest source of revenue for states and local governments, surpassing even sales and income taxes. Between 16.8 and 64.0% of state tax revenue comes from property taxes. (Here’s a look at which counties in each state have the highest average tax burden for households.)


The sum Americans fork over a year in property taxes is determined by the local property tax rate and the property value. If the local property tax rate is 1% and the value of a single-family home in a given year is $200,000, the property tax payment would be $2,000.
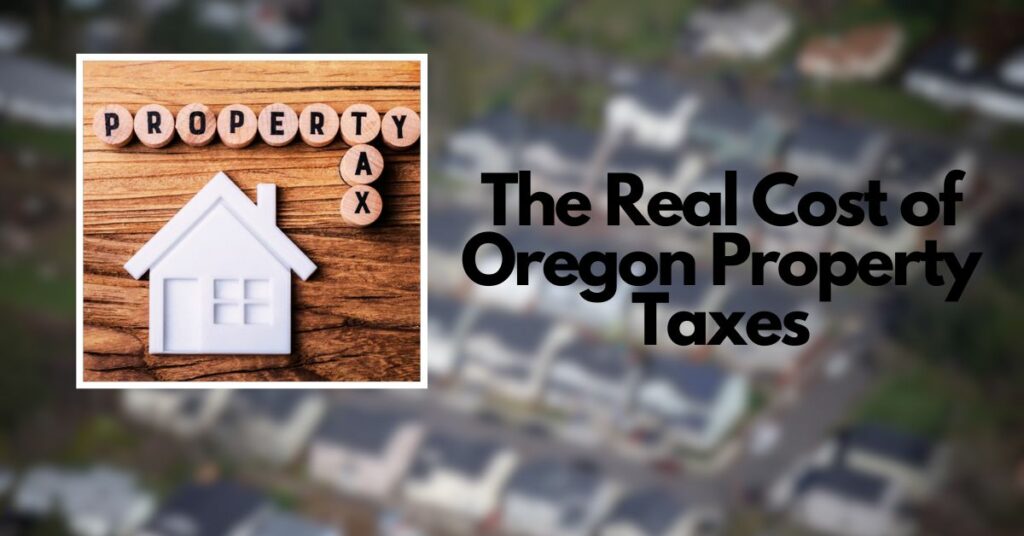
According to the American Community Survey of the United States Census Bureau, Oregon will be the sixth most expensive housing market in the US in 2021, with a median home value of $422,700. Furthermore, Oregon had the 24th highest effective property tax rate in 2021 among the 50 states, as reported by the Tax Foundation, an independent nonprofit tax policy research group.
Recent events in Oregon and the most up-to-date details are summarized below.
- Amazon Invests in Eastern Oregon: $1 Billion Tax Breaks for New Data Centers.
- Oregon Worker Relief Introduces Home Fund for Immigrants Facing Eviction
In the meantime, Oregon’s state and local property tax revenues in fiscal year 2020 amounted to $1,730 per resident, compared to $1,810 nationally.
The Tax Foundation was used to collect and generate all tax information included in this article.
| Rank | State | Effective property tax rate, 2021 (%) | Per capita state & local prop. tax collections, FY2020 ($) | Median home value, 2021 ($) |
|---|---|---|---|---|
| 1 | New Jersey | 2.23 | 3,431 | 389,800 |
| 2 | Illinois | 2.08 | 2,268 | 231,500 |
| 3 | New Hampshire | 1.93 | 3,285 | 345,200 |
| 4 | Vermont | 1.83 | 2,860 | 271,500 |
| 5 | Connecticut | 1.79 | 3,295 | 311,500 |
| 6 | Texas | 1.68 | 2,216 | 237,400 |
| 7 | Nebraska | 1.63 | 2,088 | 204,900 |
| 8 | Wisconsin | 1.61 | 1,717 | 230,700 |
| 9 | Ohio | 1.59 | 1,458 | 180,200 |
| 10 | Iowa | 1.52 | 1,806 | 174,400 |
| 11 | Pennsylvania | 1.49 | 1,644 | 222,300 |
| 12 | New York | 1.40 | 3,118 | 368,800 |
| 13 | Rhode Island | 1.40 | 2,449 | 348,100 |
| 14 | Michigan | 1.38 | 1,594 | 199,100 |
| 15 | Kansas | 1.34 | 1,712 | 183,800 |
| 16 | Maine | 1.24 | 2,862 | 252,100 |
| 17 | South Dakota | 1.17 | 1,606 | 219,900 |
| 18 | Massachusetts | 1.14 | 2,638 | 480,600 |
| 19 | Minnesota | 1.11 | 1,776 | 285,400 |
| 20 | Maryland | 1.05 | 1,744 | 370,800 |
| 21 | Alaska | 1.04 | 2,276 | 304,900 |
| 22 | Missouri | 1.01 | 1,114 | 198,300 |
| 23 | North Dakota | 0.98 | 1,538 | 224,400 |
| 24 | Oregon | 0.93 | 1,730 | 422,700 |
| 25 | Georgia | 0.92 | 1,336 | 249,700 |
If you found this article helpful, please add focushillsboro.com to your bookmarks and check back regularly to see any improvements we may have made.
(Source)